Hubspot
Creating infographics can be a fun, visually appealing way to share data or information. But, it can also be a time-consuming process. Especially if you don’t have any design experience. In this article, we’re going to show you how to create 15 fa...
Hubspot
Creating infographics can be a fun, visually appealing way to share data or information. But, it can also be a time-consuming process.
Especially if you don’t have any design experience.
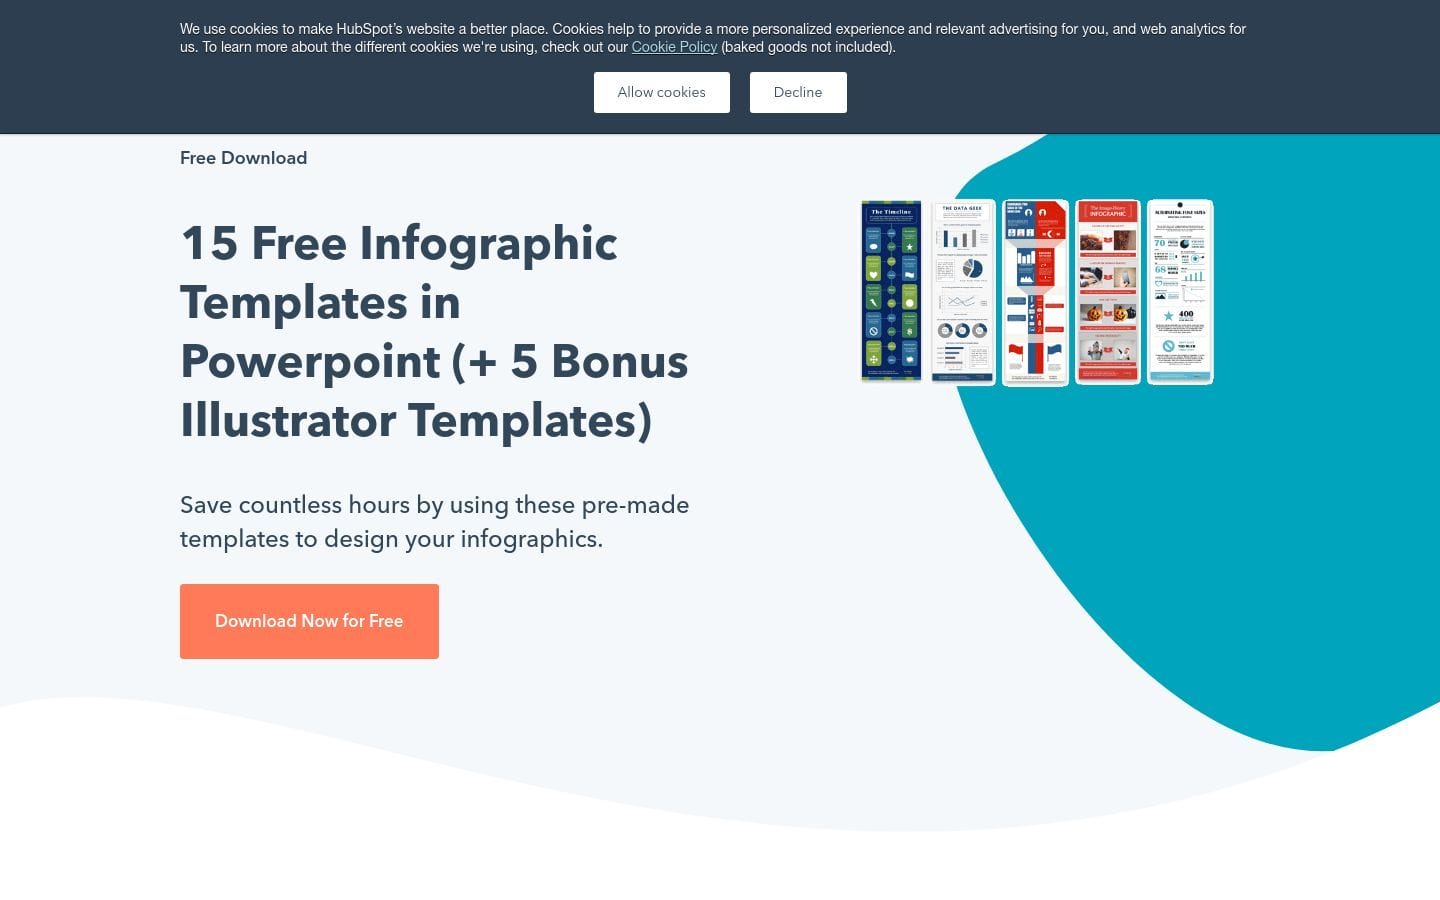
In this article, we’re going to show you how to create 15 fabulous infographics in PowerPoint and Illustrator – using nothing but our free template.
Why Use Infographics?
In a world where we’re constantly bombarded with information, it can be difficult to get your message across.
This is where infographics come in.
Infographics are a visual representation of data or information.
And, they’re a great way to communicate a message, because they’re easy to understand and engaging to look at.
Plus, they can help to improve your website’s SEO, because they can help to increase your website’s traffic and engagement levels.
How to Create an Infographic There are a few things you need to keep in mind when creating an infographic: 1.
Keep it simple The best infographics are simple and easy to understand.
Don’t try to cram too much information into one infographic. 2.
Use visuals Infographics are a visual representation of data or information.
So, make sure to use lots of visuals, such as charts, graphs and images. 3.
Use a catchy headline The headline is the first thing that people will see, so make sure it’s catchy and interesting. 4.
Use a simple color scheme Keep the color scheme simple, so that it’s easy to read. 5.
Use typography wisely Choose a font that is easy to read and matches the tone of your infographic.
Now, let’s take a look at how to create an infographic in PowerPoint and Illustrator.
How to Create an Infographic in PowerPoint 1.
Start by downloading and opening our free infographic template. 2.
Next, insert your data into the infographic.
You can do this by inserting charts and graphs, or by copying and pasting text from a Word document. 3.
Once you’ve inserted your data, it’s time to start designing your infographic.
To do this, you can use the shapes and text boxes that are included in the template. 4.
You can also add your own images by clicking on the ‘Insert’ tab and selecting ‘Picture’. 5.
Once you’ve finished designing your infographic, it’s time to save it.
To do this, go to the ‘File’ tab and select ‘Save As’. 6.
Give your infographic a name and select the file format (PPT or PDF).
Then, click ‘Save’.
How to Create an Infographic in Illustrator 1.
Start by downloading and opening our free infographic template. 2.
Next, import your data into Illustrator. You can do this by selecting the ‘File’ tab and clicking on ‘Import’. 3.
Once you’ve imported your data, it’s time to start designing your infographic.
To do this, you can use the shapes and text boxes that are included in the template. 4.
You can also add your own images by selecting the ‘File’ tab and clicking on ‘Place’. 5.
Once you’ve finished designing your infographic, it’
About Us

Aslam.ai
Aslam.ai is the world's best curated list of the tools on the internet. Whether you're looking for a new AI tool, reviews, news, We're here.
-

-

-

-
 2 years ago

Latest Comments 0 Responses